In today’s cutthroat global markets, manufacturers must deliver innovative products and meet customer demands more than ever before. That means any losses that impact the overall equipment effectiveness (OEE) of a plant, such as tooling maintenance availability loss, must be minimized. My role at Form Technologies and its subsidiary, Dynacast, was to tackle this exact challenge at various North American Dynacast plants by leading and managing the following project that was divided into three phases:
- Phase 1 – Design and upgrade the unplanned tooling downtime data collection system to collect more relevant data on various tooling maintenance activities, such as repair details, types of repairs, and elapsed time
- Phase 2 – Improve and standardize the reporting of tooling maintenance data to managers, supervisors, and production scheduler to help them better understand trends on downtime attributed to tooling issues and optimize production scheduling
- Phase 3 – Develop and implement an inventory management and electronic Kanban system that stores, tracks, and maintains critical spare tooling components to prevent stockouts and long repair lead times
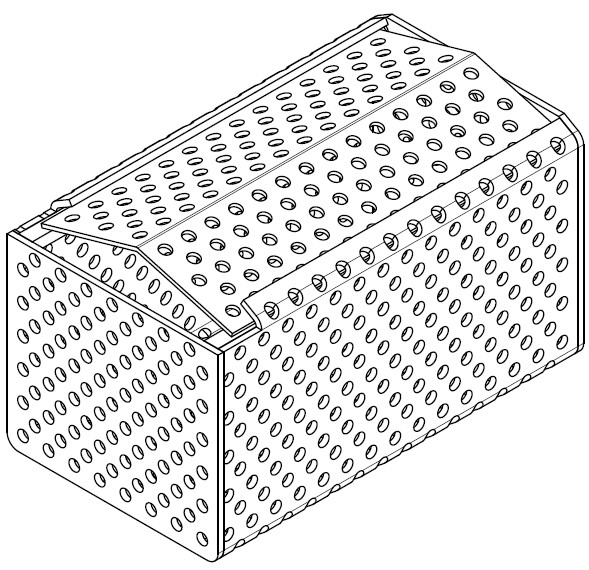
- Designed a new thermal deburr basket that increase thermal deburr throughput by 50% at constant labour hours
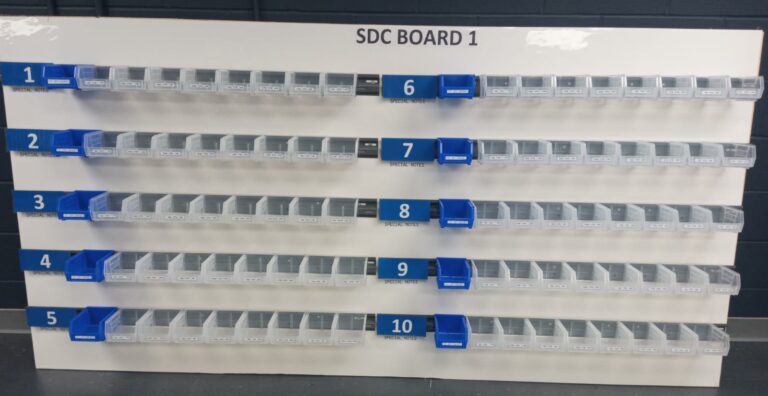
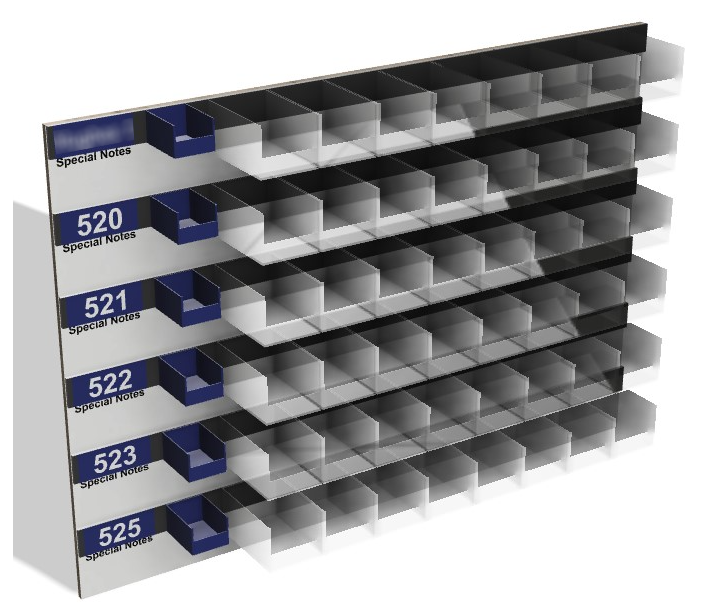
- Devised a new quality sample board that consolidates all hourly check samples for each machine in a given area, eliminating the need to visit each and every machine
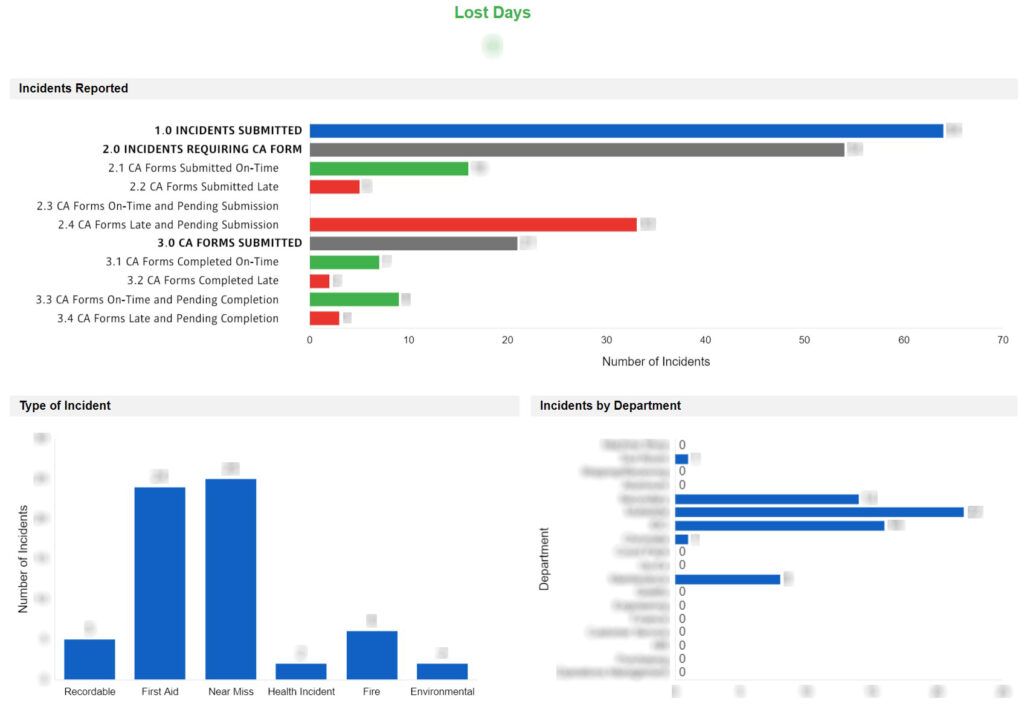
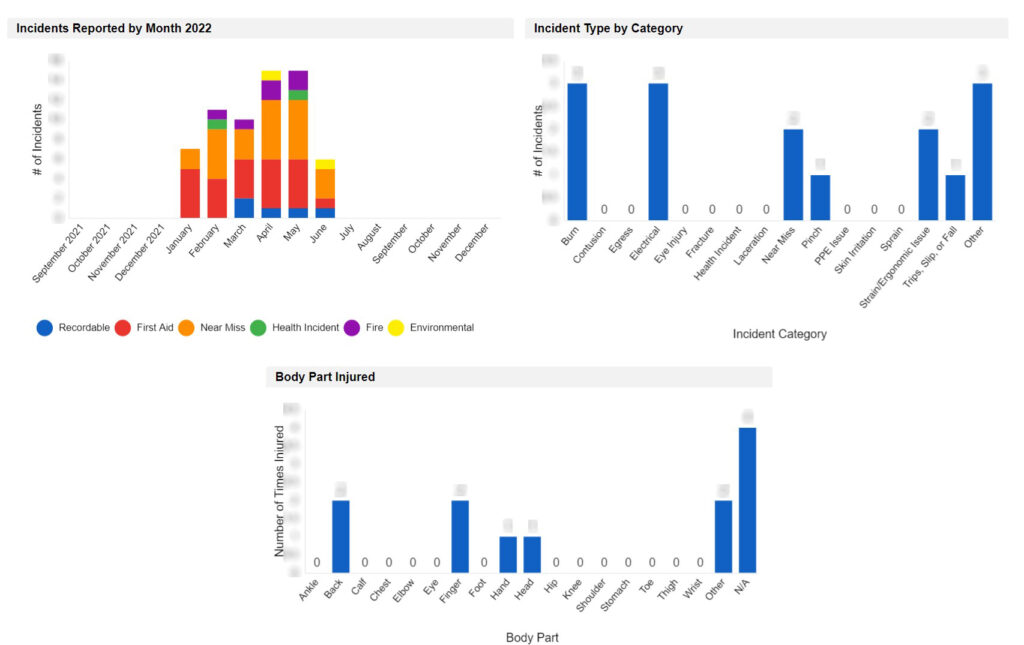
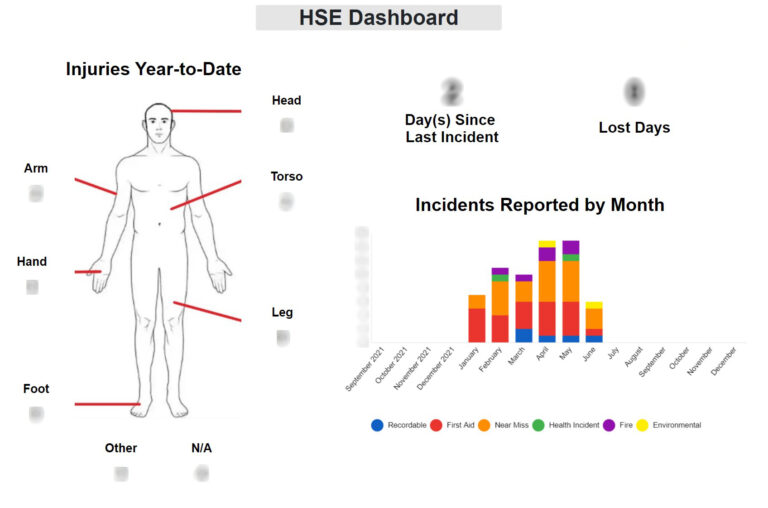
- Improved and standardized live safety reporting throughout North America on Smartsheet
Phase 1 – Tooling Downtime Data Collection System
To drive tooling maintenance improvements, data collection on tool repair work is required for analysis in order to understand and identify trends on downtime attributed to tooling issues. Based on this information, business decisions, such as scheduling tooling preventive maintenance to avoid costly unplanned downtime from unexpected equipment failure can be made effectively.
The North American facilities currently use various methods of collecting these data. Some use enterprise resource planning (ERP) software, whilst others use more traditional pen and paper. The plant I was tasked with piloting the project originally collected its data using QAD ERP software and barcode scanning system. Toolmakers and production inputted data on the tools, the reason for downtime, and repair times manually into the computer/tablets or by scanning barcodes where applicable.
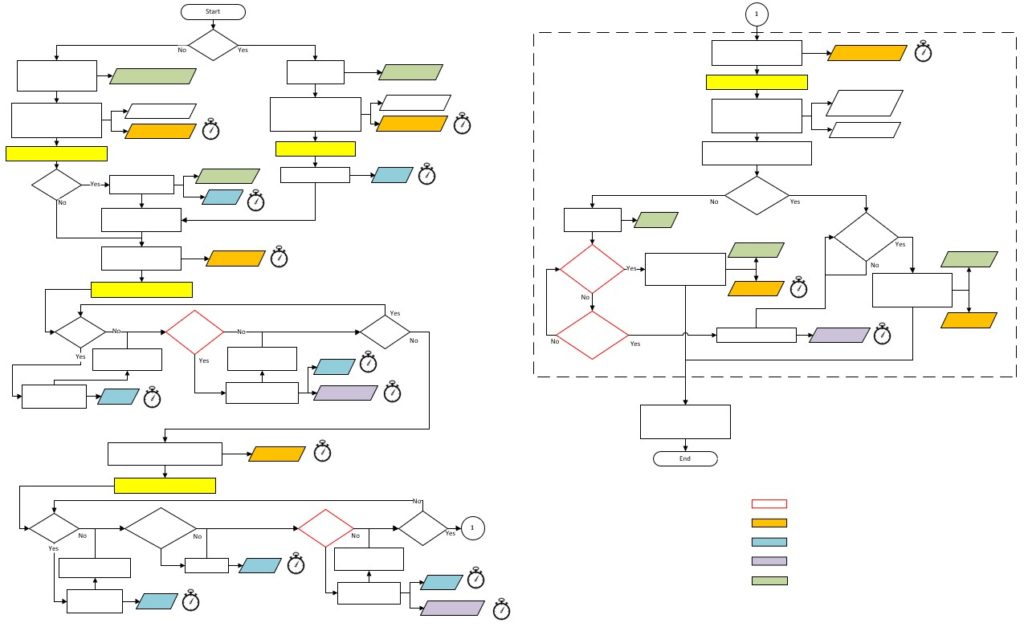
However, there were gaps within the original system that prevented it from capturing and collecting accurate elapsed time for various phases of an unplanned tooling maintenance activity. Moreover, the downtime reasons (which are formatted into codes) did not adequately capture issues addressed during a tool repair. These were identified using lean six sigma tools, such as process mapping the current state, SIPOC, Ishikawa diagrams, and Pareto charts. In addition, interviews were done with and feedback was obtained from the main users of the system, such as toolmakers, supervisors, and managers.
To address these gaps, subject matter experts from various departments and I worked together to redesign the data collection process (outline of the new process shown in Figure 1), remove unnecessary sub-processes from the current process, redefine the tooling downtime definitions, reprogram the backend system logic of the ERP software, and revise the downtime reason codes. The solutions were developed using root cause analysis, team brainstorming, process failure modes and effects analysis, process maps, and flowcharts. The requirements were then summarized in a Project Requirements and Design Specifications report.
Phase 2 – Reporting of Tooling Maintenance Data
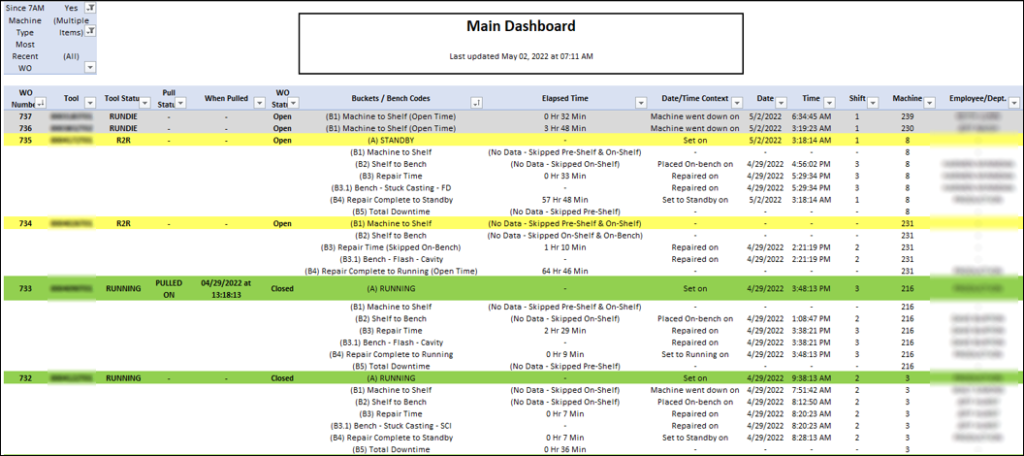
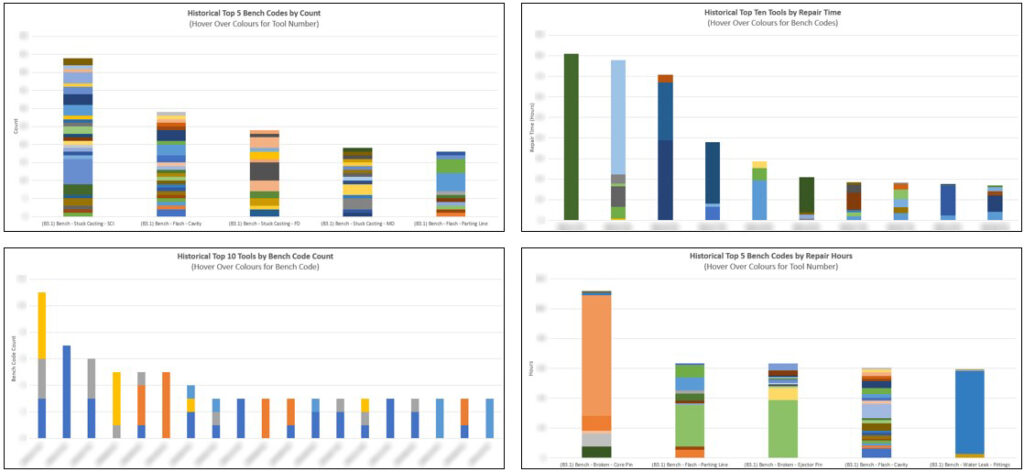
As much as collecting and storing accurate data on tooling maintenance activities is a vital step towards reducing the availability loss due to tooling issues, the data essentially become useless unless they are correctly processed and reported to relevant users in a simple, standardized, and readily available format. Since all facilities did not have the required reporting tool, a new reporting system was developed that utilizes the QAD ERP software and Excel VBA to satisfy the following:
- Reporting system that automatically generates reports to key users, such as managers, supervisors, and production scheduler
- Reports sent to the engineering manager and toolroom supervisor are to include trends on downtime attributed to tooling issues and key performance indicators regarding repair times on a weekly, monthly, and quarterly basis
- Reports sent to the scheduler and operations are to include programs and products that are impacted due to tooling issues and data on machine availability on an immediate, daily, and weekly basis


Phase 3 – Inventory Management System
If certain tooling components are found to be damaged during a tooling maintenance activity and need replacement, toolmakers repair the tool by replacing those components with in-house prefabricated or purchased spare tooling components. A well-designed inventory management system that incorporates the concepts of Kanban is required to ensure these spare components are consistently replenished and are available just-in-time.
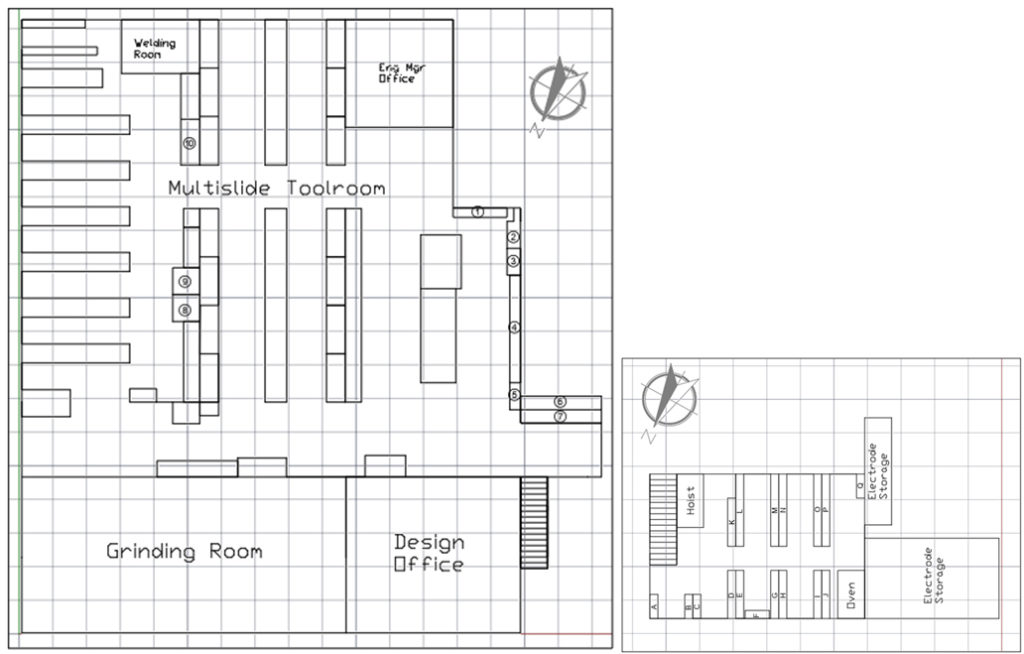
However, the inventory management system at various facilities were such that the inventory levels of the spare components (especially the “critical” spares that affect the tooling cavity and/or have long replenishment lead time) were not tracked nor maintained. This caused long lead times for tooling repairs due to the lack of timely demand signaling and stockouts. These issues were identified by conducting interviews with various subject matter experts and analyzing inventory. It was then documented it on flowcharts and process maps using Microsoft Visio, and in 2D plant layout drawings using Autocad (see Figure 2).
To address these issues, a new inventory management and electronic Kanban (e-Kanban) system using the QAD ERP software was developed and implemented that stores, tracks, and maintains the critical spare tooling components that prevents stockouts and long repair lead times.
Additional Accomplishments
Thermal Deburr Basket – Increased thermal deburr throughput by 50% at constant labour hours
Quality Sample Board – Consolidates all hourly check samples for each machine in a given area, eliminating the need to visit each and every machine

Live Safety Reporting – Improved and standardized across all North American Dynacast plants on Smartsheet
