Lightweight Yet Strong – Optimizing Strength-to-Weight Ratio in ANSYS
What captivates me (and probably many others as well) is when a product or a structure that looks seemingly weak and flimsy can perform its function exceedingly well. A few good examples that come to mind are modern lightweight sport bicycles and cable-stayed bridges… All I see is air in between the thin structural components, yet they are extremely strong!
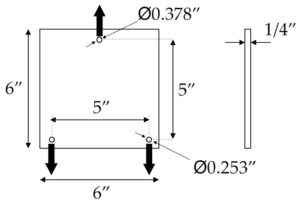
When I had the opportunity to design my own part to have a maximum strength-to-weight ratio in my Mechanics of Solids II course, I was definitely eager to test and demonstrate my mechanical design skills through this design project. I was provided with a square acrylic PMMA sheet with a mass of around 173 grams and dimensions shown in Figure 1. The part was to undergo a 3-point tensile test where the 0.378″ top hole remained constrained and the two 0.253″ bottom holes were pulled away from the top hole with equal tensile force.
Results – The acrylic part was optimized to have a strength-to-weight ratio from 15.49 N/g (square acrylic sheet) to 78.01 N/g (5x increase) while reducing the mass down from 173 grams to 16.92 grams (more than 90% decrease). While the part was predicted to fail at a tensile load of 1280 N in ANSYS, it achieved an actual 1.32 kN of tensile load when tested. This meant not only did the part withstand more load than predicted, but also the prediction was off by only 3.1%.
▲ Figure 1 - Dimensions of the Acrylic PMMA Sheet
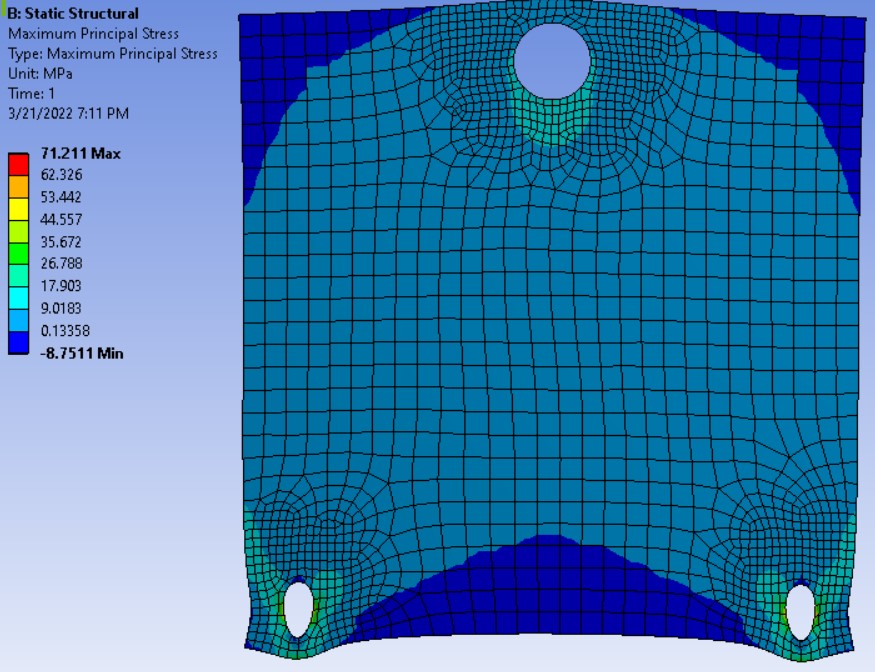
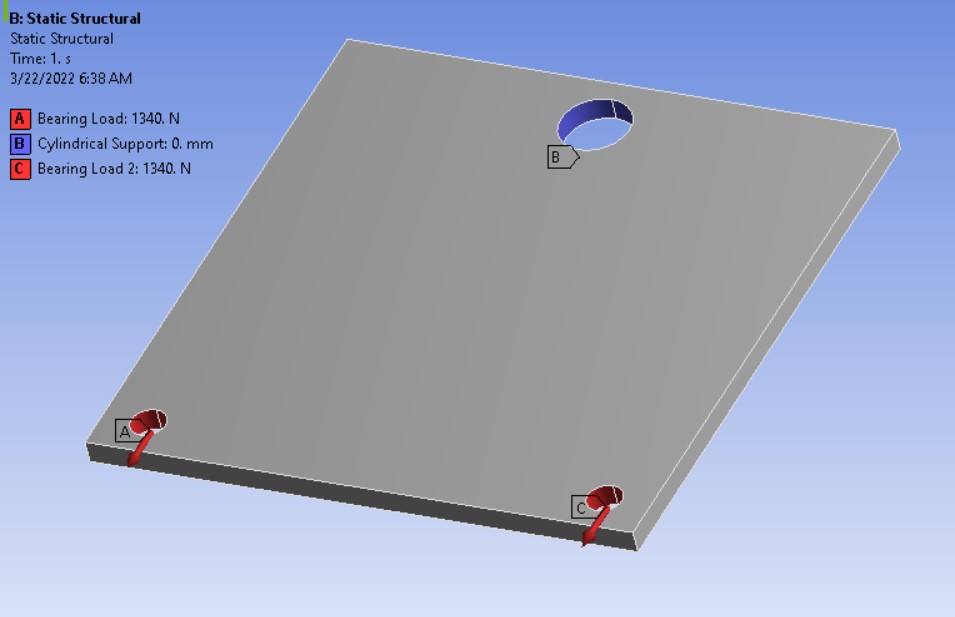
I first tested how strong the square acrylic PMMA sheet would be without any modifications in ANSYS. Knowing that PMMA has an ultimate tensile strength of 71 MPa, the results (shown in Figure 2) demonstrated the square sheet can withstand a tensile force of around 2.68 kN (a strength-to-weight ratio of 15.49 N/g). Because PMMA is considered brittle, maximum principal stress values were analyzed instead of equivalent stress (von Mises). Figure 3 shows the loads and supports applied to the sheet.
▲ Figure 2 - Square PMMA Sheet Results
▲ Figure 3 - Boundary Conditions
The results showed a lot of blue (minimally stressed) areas around the top two corners and the bottom middle area between the bottom two holes. This formed almost a triangular area where the stresses were mostly concentrated. To achieve the best strength-to-weight ratio, the minimally stressed areas had to be removed and a triangular part had to be designed.
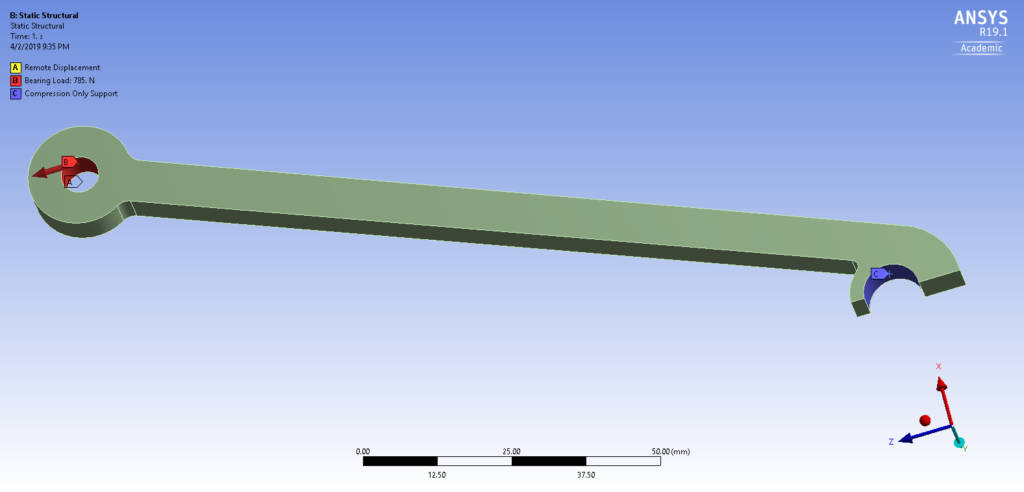
The part was designed through an iterative process to create the final geometry. This meant finite element analysis was performed in ANSYS for each iteration. In general, the 3D model of the part was first symmetrically cut lengthwise to reduce the number of nodes utilized during an analysis. Boundary conditions were then applied to the part. Figure 4 shows the boundary conditions applied to the final design.
▲ Figure 4 - Boundary Conditions on Final Part
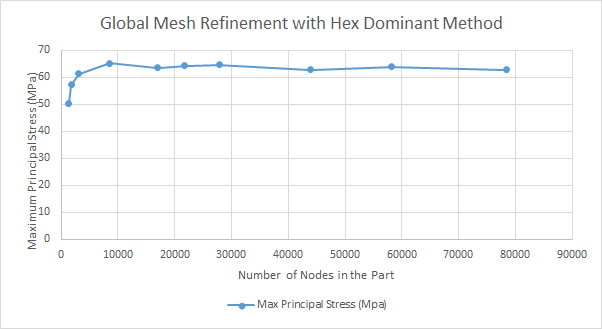
Afterwards, mesh and convergence analysis was performed by observing the convergence of the maximum principal stress of the part under tensile load as the global element size decreased. The hex dominant method was utilized for this analysis because quadrilaterals allow for better interpolation of displacements than triangles. Moreover, the part is mostly flat and does not require an optimal mesh fit around curves. The data collected for this analysis on the final part is illustrated in Figure 5. Upon analysis of this data set, the stress values converged when the number of nodes surpassed 8518 and the element size decreased below 2 mm.
▲ Figure 5 - Convergence of the Maximum Principal Stress Values as the Element Size Decreased
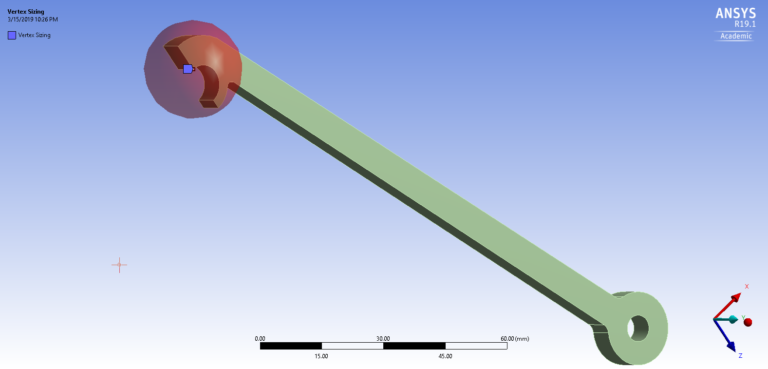
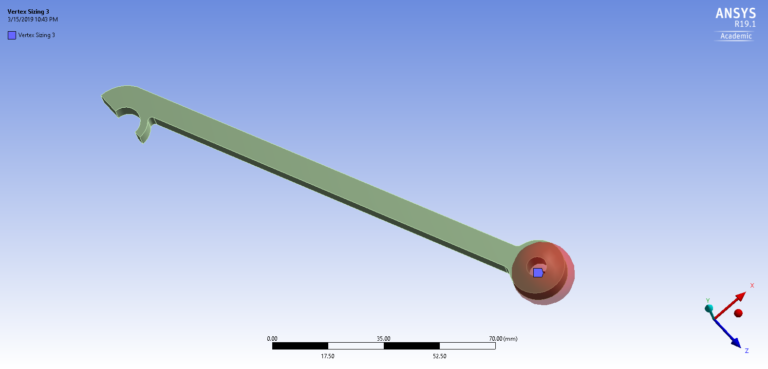
Next, a refined mesh analysis was performed by observing the convergence of the maximum principal stress values as the sizes of the mesh element near the top and bottom holes decreased. The refined mesh around these areas are shown in Figure 6. These areas were chosen to be refined because the initial modeling predicted that these areas were to experience high principal stresses.
▲ Figure 6 - Refined Mesh Areas
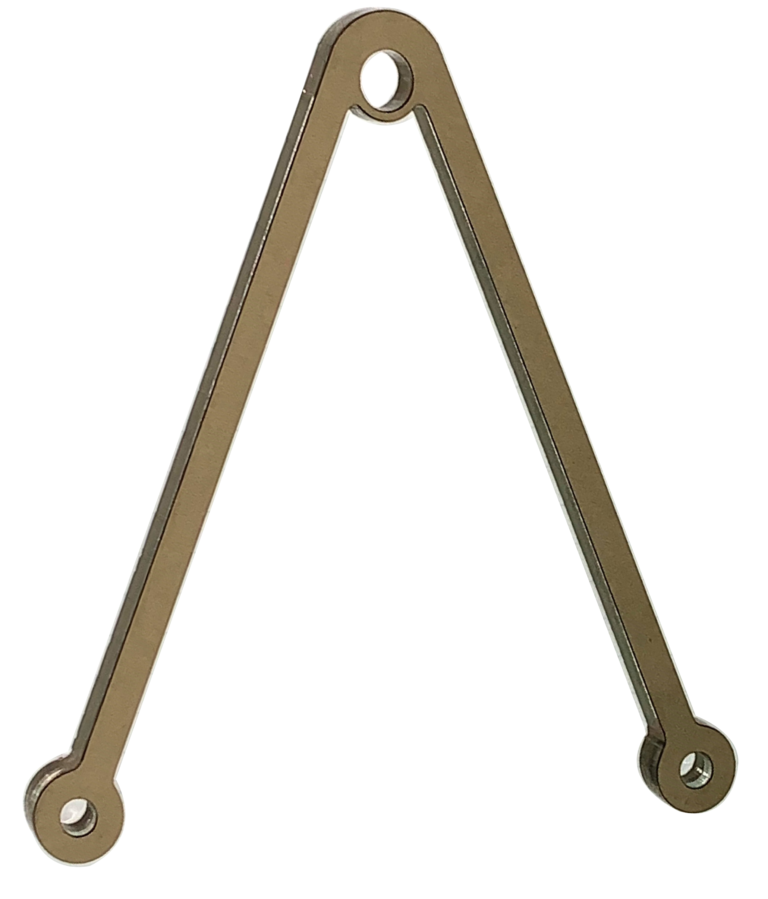
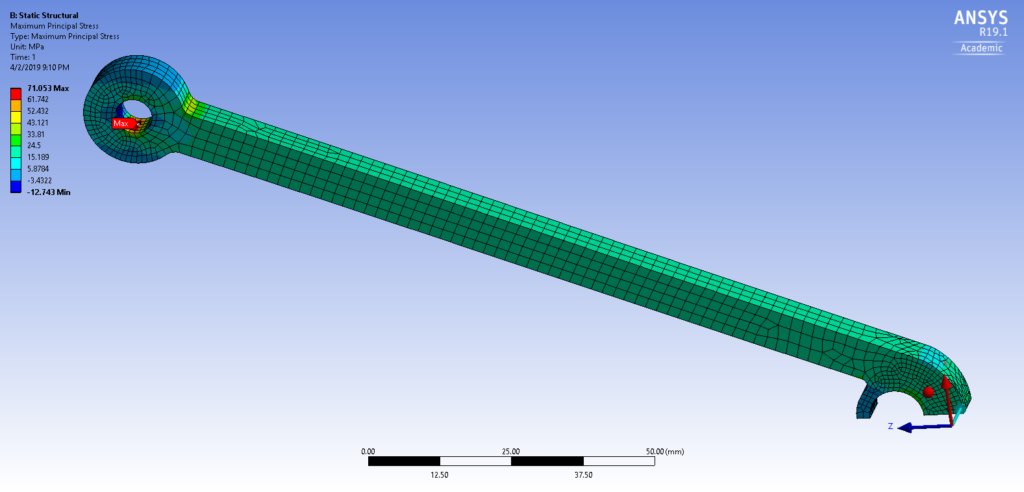
The final part design is shown in Figure 7. After applying a bearing load of 640 N to each of the two bottom holes in ANSYS (which equates to a total tensile force of 1280 N), I obtained the following results shown in Figure 8. It was predicted that at least one of the two bottom holes were to fail.
▲ Figure 6 - Actual Part Cutout
▲ Figure 8 - Stress Distribution of Final Part Design
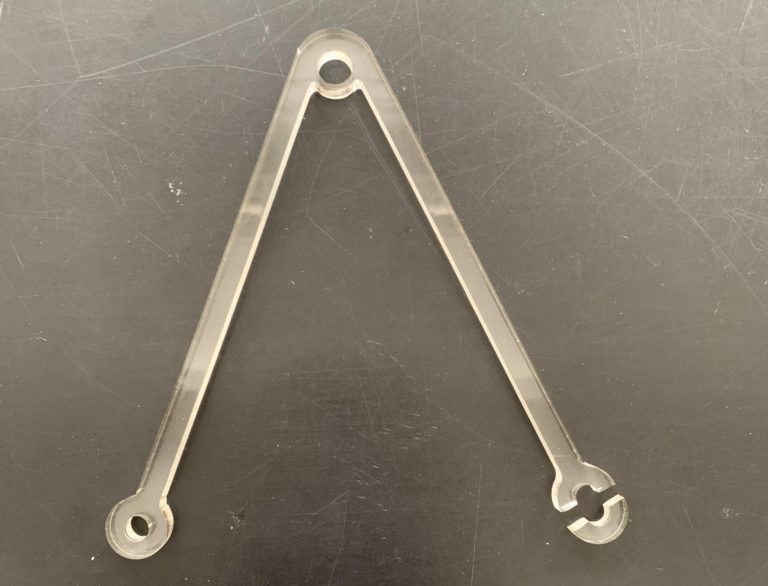
The part was then cutout from the PMMA sheet. It was placed in a tensile testing machine, and the load was applied until failure. The failed part is shown in Figure 9. The part failed at a tensile load of 1.32 kN.
▲ Figure 9 - Fractured Part
In the end, the acrylic part was optimized to have a strength-to-weight ratio from 15.49 N/g (square acrylic sheet) to 78.01 N/g (5x increase) while reducing the mass down from 173 grams to 16.92 grams (more than 90% decrease).
While the part was predicted to fail at a tensile load of 1280 N in ANSYS, it achieved an actual tensile load of 1.32 kN when tested. This meant not only did the part withstand more load than predicted, but also the prediction was off by only 3.1% and the part failed right around the area it was predicted to fail.